Hidden gems are, by definition, hidden.
Where no analyst is looking and no screener has reliable figures, smallcap finds and reads the annual reports nobody else is reading, and links every figure back to the page of the filed PDF.
Then it values each company with a model whose assumptions you can change, writes up what it finds, and sends a letter every week on the model portfolios and the news.
- Report reached the market
- 20 Aug 2025
- Bear · base · bull
- 494p · 770p · 1,011p
- Close that week
- 1,244p, +62% to base
- Status
- published as struck
| Vintage | Valued | Bear | Base | Bull | Close that week | Close to base | Status |
|---|---|---|---|---|---|---|---|
| FY2016 | 29 Jul 2016 | 280p | 427p | 561p | 345p | −19% | published as struck |
| FY2017 | 2 Aug 2017 | 259p | 436p | 570p | 406p | −7% | published as struck |
| FY2018 | 30 Aug 2018 | 378p | 569p | 697p | 411p | −28% | published as struck |
| FY2019 | 9 Aug 2019 | 346p | 651p | 814p | 448p | −31% | revised before publication |
| FY2020 | 21 Aug 2020 | 404p | 659p | 824p | 620p | −6% | revised before publication |
| FY2021 | 26 Aug 2021 | 375p | 646p | 840p | 546p | −15% | published as struck |
| FY2022 | 25 Aug 2022 | 252p | 484p | 627p | 531p | +10% | published as struck |
| FY2023 | 23 Aug 2023 | 290p | 458p | 618p | 507p | +11% | published as struck |
| FY2024 | 21 Aug 2024 | 426p | 638p | 833p | 874p | +37% | published as struck |
| FY2025 | 20 Aug 2025 | 494p | 770p | 1,011p | 1,244p | +62% | published as struck |
Higher returns, few readers,
and priced well below their own history.
Three figures about UK small companies, and the reason smallcap covers them and not the FTSE 100. None of the figures is ours; the source is under each.
Annualised total return, income reinvested, excluding investment companies. 3.3 points a year, compounded over 64 years.
Marsh & Evans, London Business School, Numis Smaller Companies Index review, 2020Analysts per company. Even the largest AIM companies, over £600m, averaged 6.1 in 2019. For most AIM companies the annual report is the only full account of the business that gets written.
Fu, Jenkinson, Newton and Xie, European Financial Management, 2023 · Hardman & Co, reported by IR Magazine, May 2019Twelve-month forward price to earnings, each against its own ten-year average. The discount is widest at the small end, and that gap is where smallcap looks.
Abrdn, Bloomberg data to 31 Jan 2025, reported by MoneyWeekEvery annual report, read into
figures you can screen.
There are many reasons small companies beat large ones over time. One of the big ones is that their accounts are hard to find, harder to analyse, and harder still to trust when there isn’t an army of analysts doing the leg-work for you. So we do it. We read each company’s annual reports as printed and keep over 200 metrics a year, each with the page, column and scale it came from. You get to screen the whole index without reading 2,609 PDFs, and you can still check any figure against its page.
Here is one: Fevertree Drinks’s FY2024 revenue, read from page 110 of 156, Note 4, column 2024. Step through the ten reports: the printed scale changes 2 times, the stored value stays in pounds.
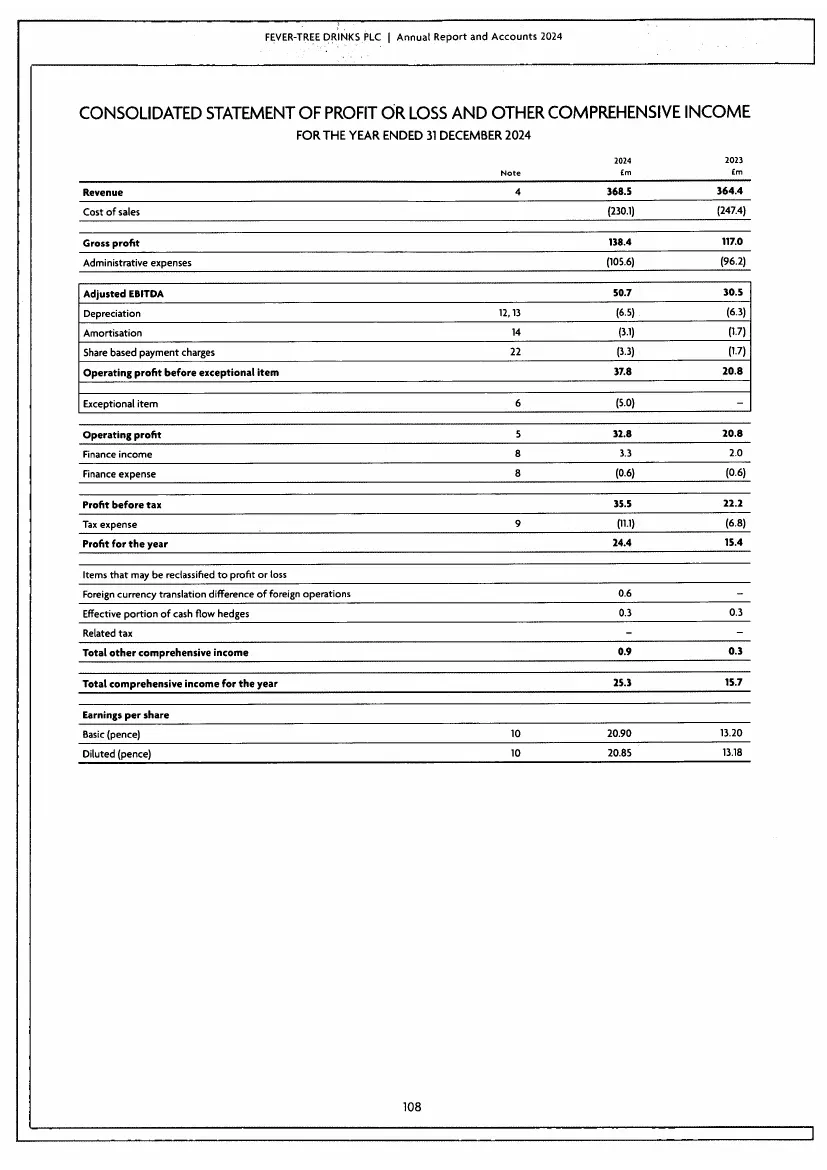
- Caption
- Revenue
- Printed
- 368.5 £m
- Column
- 2024
- Stored
- 368,500,000 GBP
- Page
- PDF 110printed 108, of 156
- Read from page 110 of FEVR-AR-2024-ch-2
- Matched across 2 readings, including the FY2025 comparative
- 8 checks run, validation passed
218,895 figures for 627 companies so far, in the dashboard, with the same page link on every one. See Fevertree Drinks
8 checks before a figure
reaches your screen.
When it’s your money on the line, you want to trust the numbers behind your decisions. So, can you trust ours? We read every figure twice: once from the report for its year, and once from the next year’s report, which prints it again. If the two agree, it’s confirmed. If they differ, both are kept. Then 8 checks run on every period, and anything that fails is flagged on the dashboard. Click any figure to open the PDF page it was taken from.
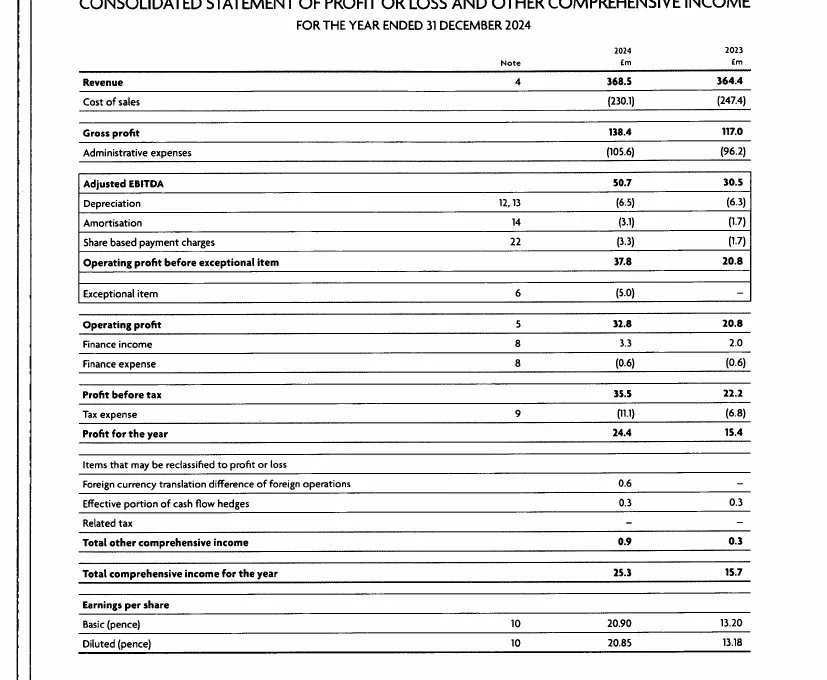
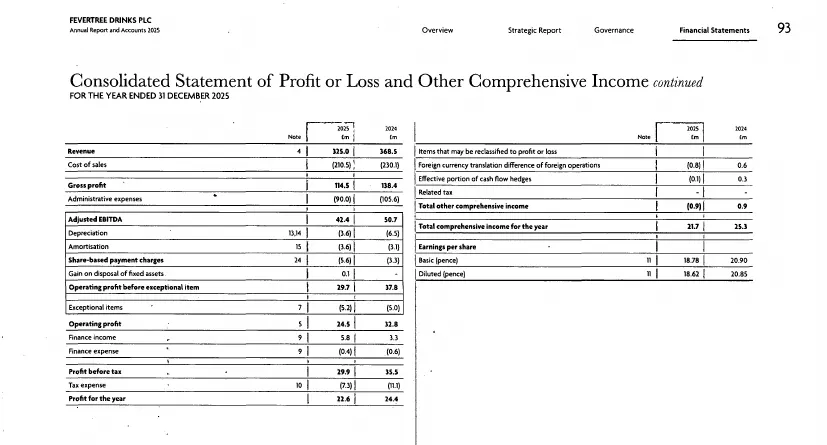
Every figure is read from two different filings: the report for its year, and the next year's report, which prints the same year again as a comparative. Take Fevertree's 2024 revenue as an example: both readings agree, so it is stored once and marked confirmed.
- First reading
- 368.5 £mFEVR-AR-2024-ch-2 · p. 110 · column 2024
- Second reading
- 368.5 £mFEVR-AR-2025-ch-3 · p. 95 · comparative column 2024
- Stored
- 368,500,000 GBPone value, both readings kept
- Two readings, from two filings, agree
- Confidence 0.98
- Stored once, with both filings kept as its sources
An intrinsic value with its assumptions
on show, and yours if you disagree.
Everybody loves a good deal. Especially investors.
Each company gets a discounted-cash-flow value with a bear and a bull case, and every assumption behind it is on show. Don’t agree with one? Change it, and the value is recomputed. Every value is struck on the day the report came out, using nothing published after it, so what you see is what you could have known at the time. Here’s how it works, step by step, for a company you may well have flown with.
The figures
Every figure here was read from the filed report the way sections 01 and 02 showed, and stored with its page. Eight reports, ending with the FY2023 report this valuation is struck on. You can see the pandemic in the middle.
| £m | FY2016 | FY2017 | FY2018 | FY2019 | FY2020 | FY2021 | FY2022 | FY2023 |
|---|---|---|---|---|---|---|---|---|
| Revenue, £bn | ||||||||
| Revenue | 1,405.4p. 40 | 1,729.3p. 41 | 2,391.8p. 47 | 3,143.1p. 57 | 3,584.7p. 75 | 395.4p. 86 | 1,231.7p. 99 | 5,033.5p. 109 |
| Operating profit | 105p. 40 | 103p. 41 | 130.6p. 47 | 203.4p. 57 | 184.6p. 75 | (336.1)p. 86 | (323.9)p. 99 | 394p. 109 |
| Profit for the year | 88.8p. 40 | 76.7p. 41 | 110.7p. 47 | 145.6p. 57 | 116p. 75 | (271.2)p. 86 | (315.4)p. 99 | 290.8p. 109 |
| Earnings per share | 60.2pp. 40 | 51.8pp. 41 | 74.6pp. 47 | 98pp. 57 | 77.9pp. 101 | (151.2p)p. 111 | (147p)p. 99 | 135.4pp. 109 |
Questions,
answered
Where the numbers come from, why each is read twice, and what happens when something doesn’t add up.
Open the dashboard